
一边在做数据库备份,一边写😭。
下午抽空,在K8S的Promethues上接入了consul。完成了微服务的JVM监控。
记录一下步骤:
创建generic secret ,内容为Prometheus 的 consul自动发现配置。
1
2
3
4
5
6
7
8
[root@ip-10-20-1-93 consul-prometheus]# cat prometheus-additional.yaml
- job_name: 'consul-dop-dev1'
scrape_interval: 15s
consul_sd_configs:
- server: dop-otter-consul-dev1.dop-dev1.svc.cs-software.local:8500
[root@ip-10-20-1-93 consul-prometheus]# kubectl create secret generic additional-scrape-configs --from-file=prometheus-additional.yaml --dry-run -oyaml > additional-scrape-configs.yaml
[root@ip-10-20-1-93 consul-prometheus]# kubectl apply -f additional-scrape-configs.yaml -n prometheus
secret/additional-scrape-configs configured修改CRD Prometheus
1
2
3
4
5在spec中增加additionalScrapeConfigs的定义
spec:
additionalScrapeConfigs:
key: prometheus-additional.yaml
name: additional-scrape-configsReload 一下
1
[root@ip-10-20-1-93 consul-prometheus]# curl -X POST http://10.20.210.204:9090/-/reload
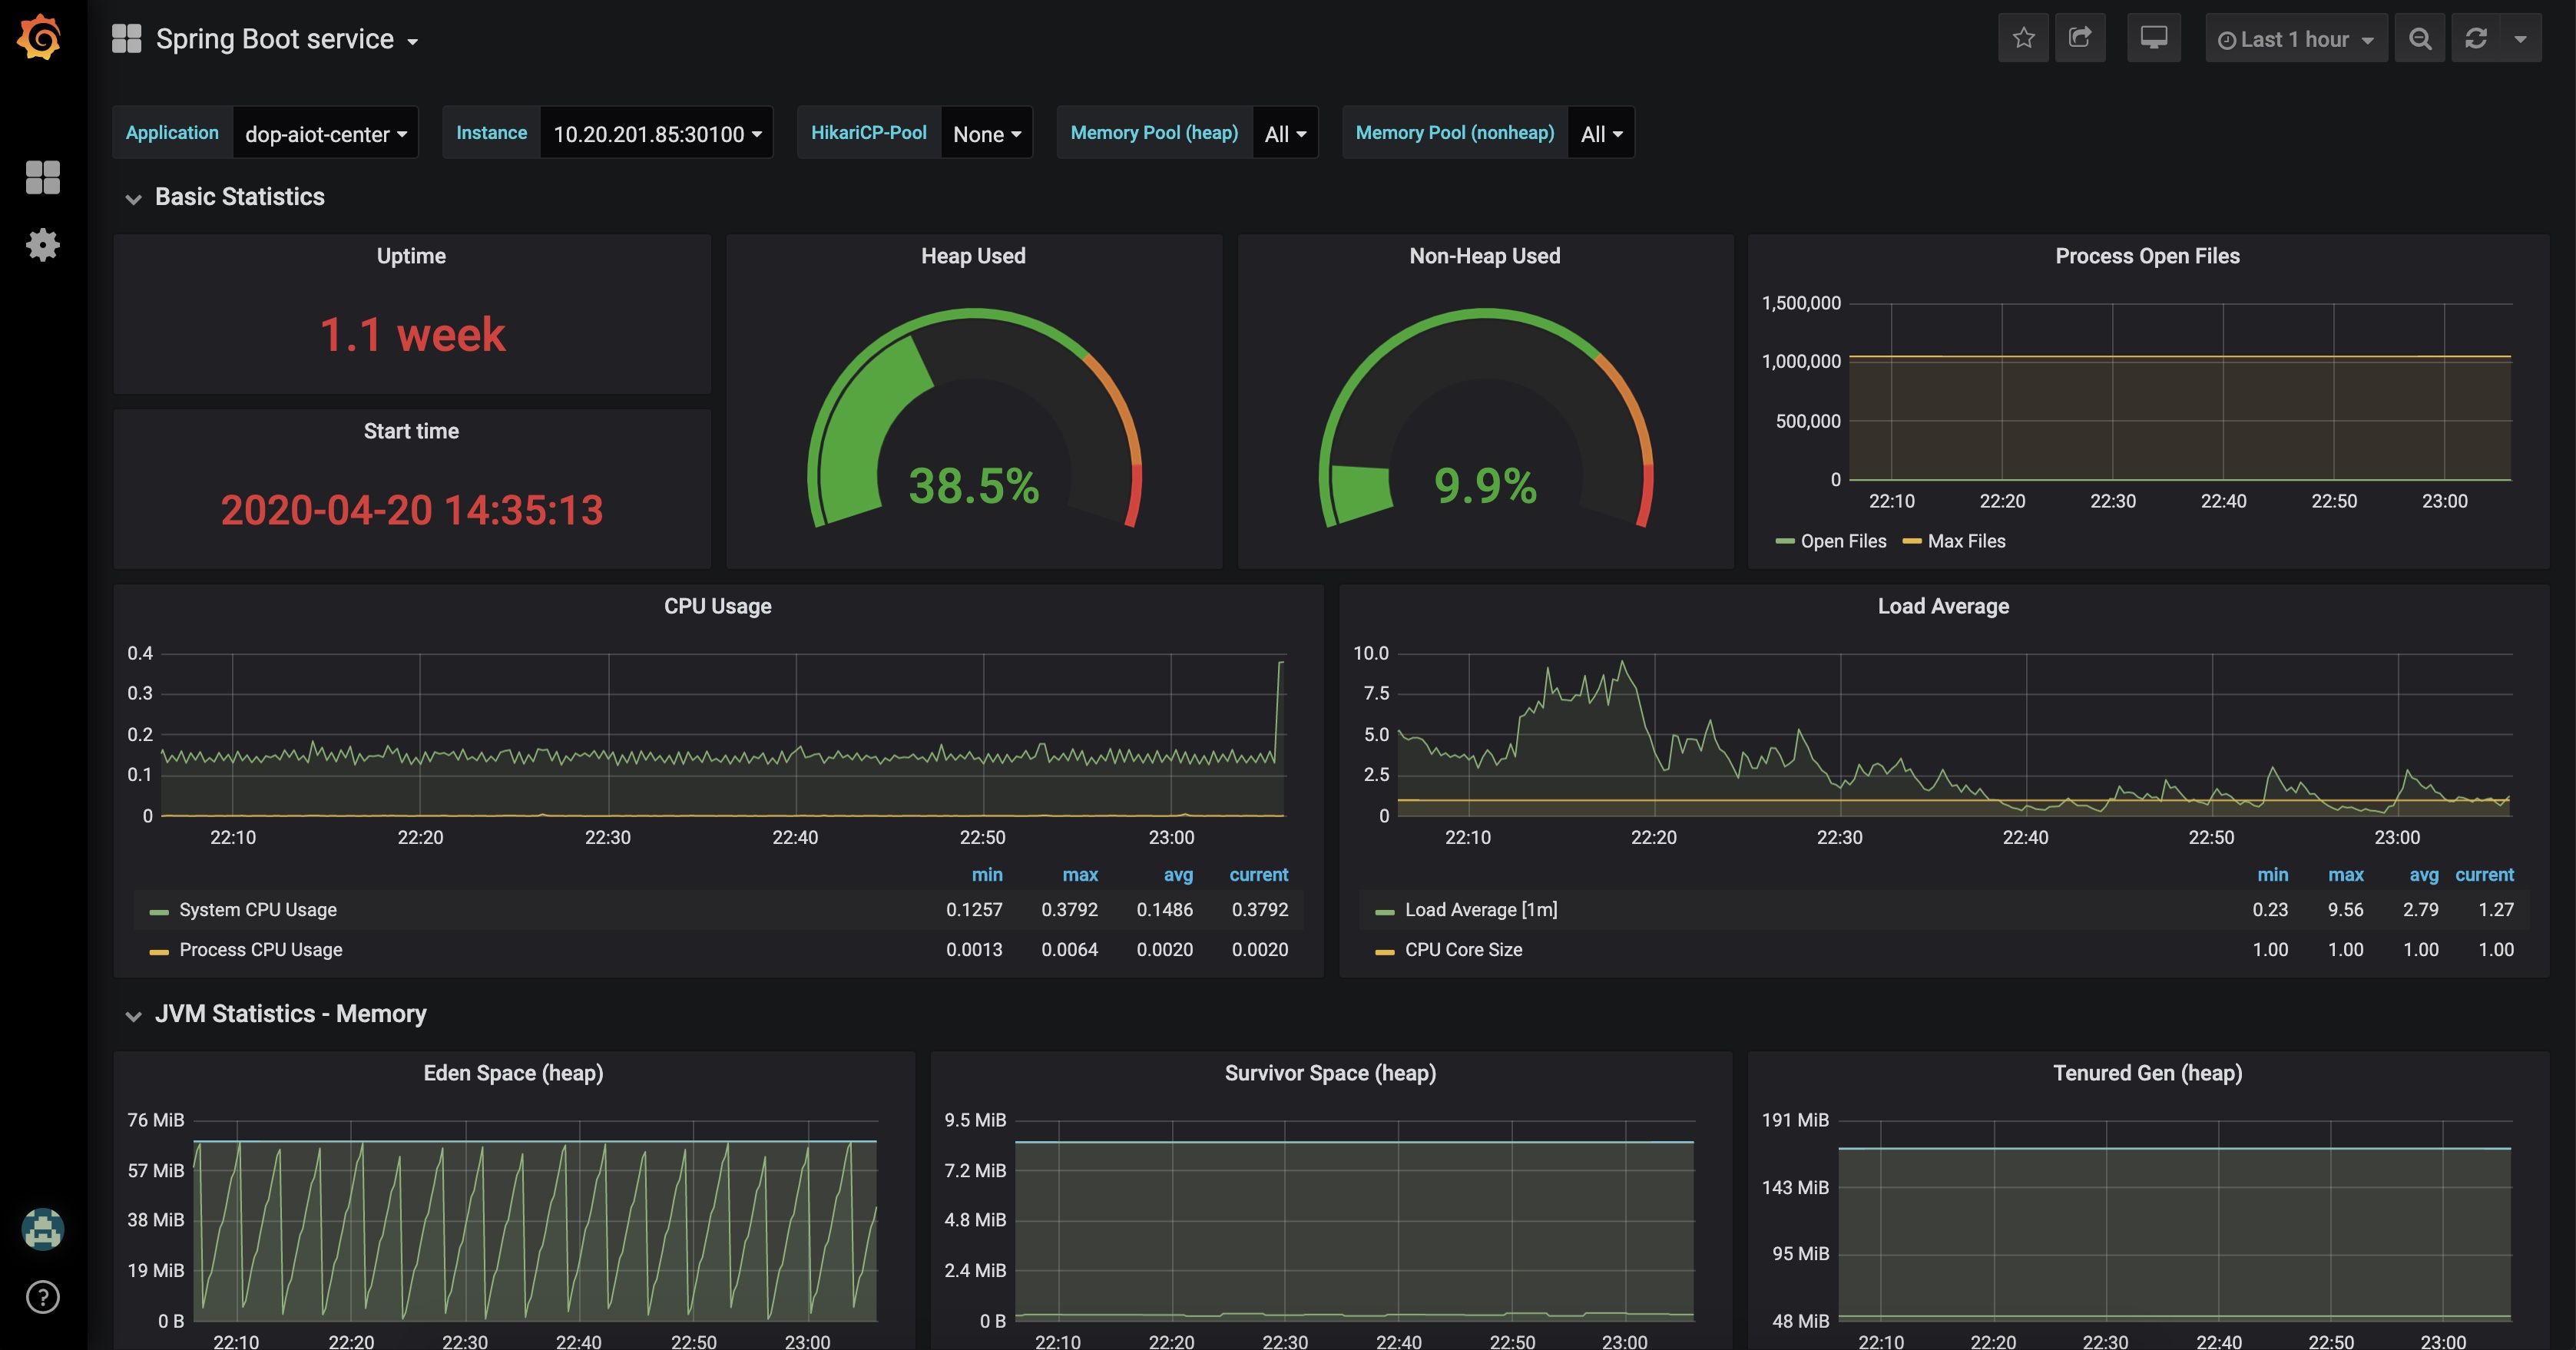
Grafana 导入 Spring Boot 2.1 Statistics
很快看到结果。